
The OUV validation reports
PDF download
The original OUV validation report was published in 2009: Validation_Report_OUV_Feb_2009.pdf
The supplement OUV validation report containing new sub-products and Metop-B products was published in 2015: Validation_Report_OUV_Feb_2015.pdf
Samples of validation results
Some images representing the results from the 2009 validation are plotted below. Click on the thumbnail images to see them larger.
Jokioinen station
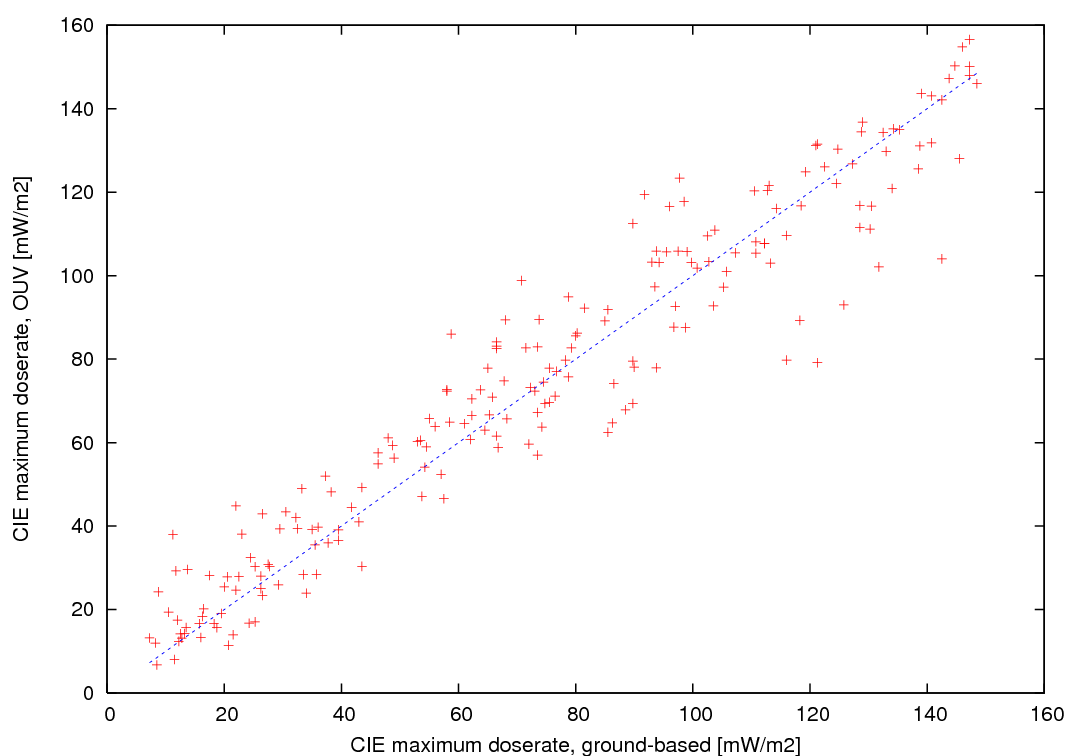
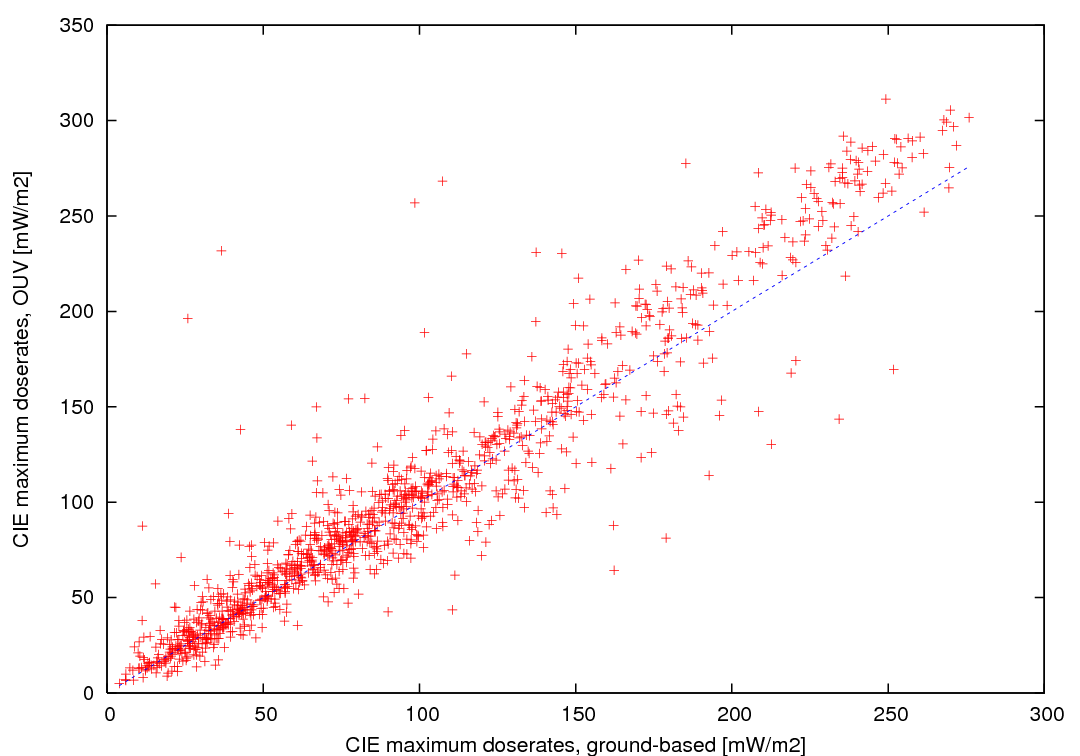
Scatter plots
| Weighting | Daily dose [kJ/m2] | Daily maximum dose rate [mW/m2] |
|---|---|---|
| CIE | 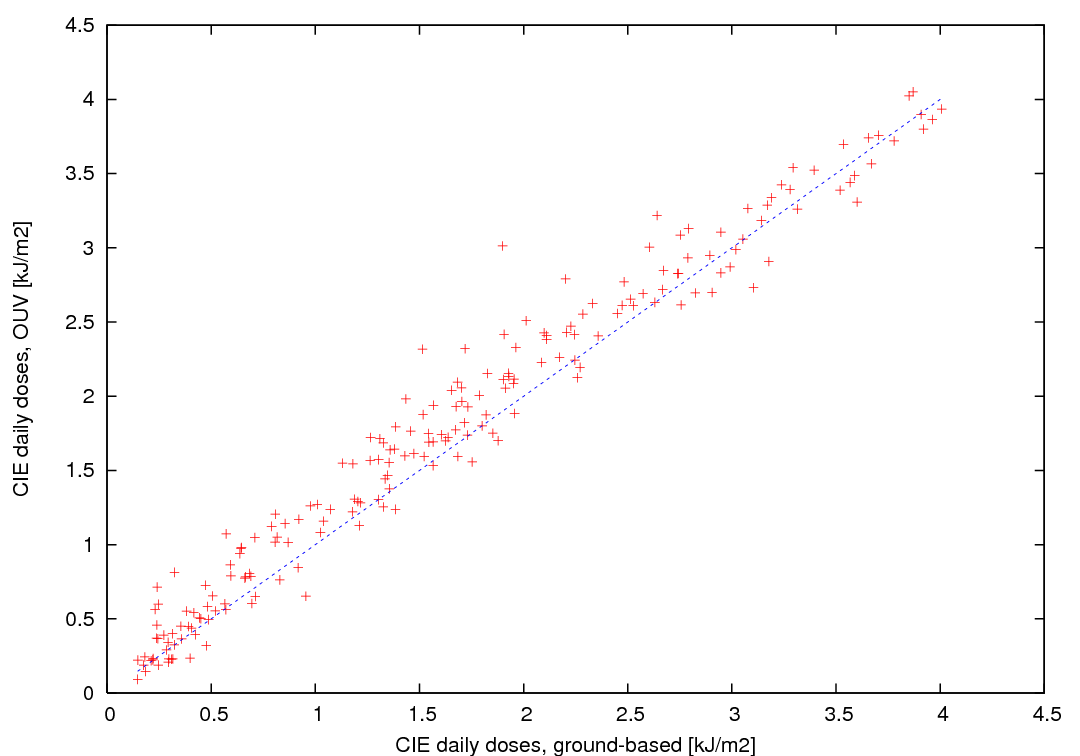 |
 |
| DNA | 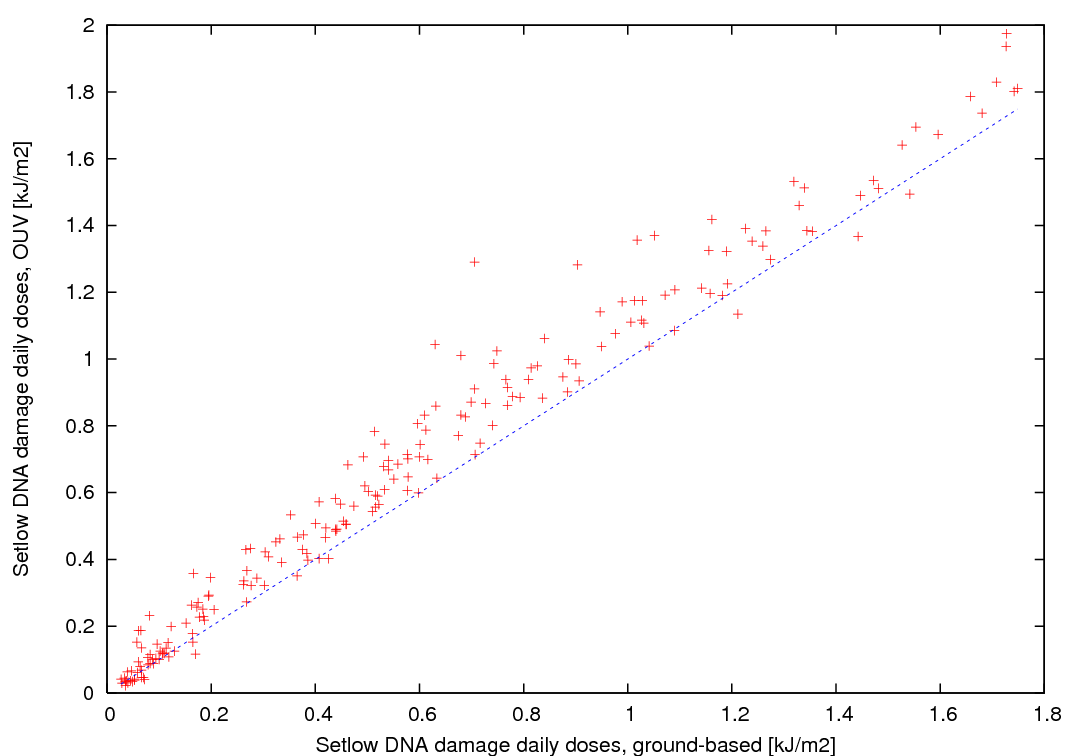 |
|
| Plant | 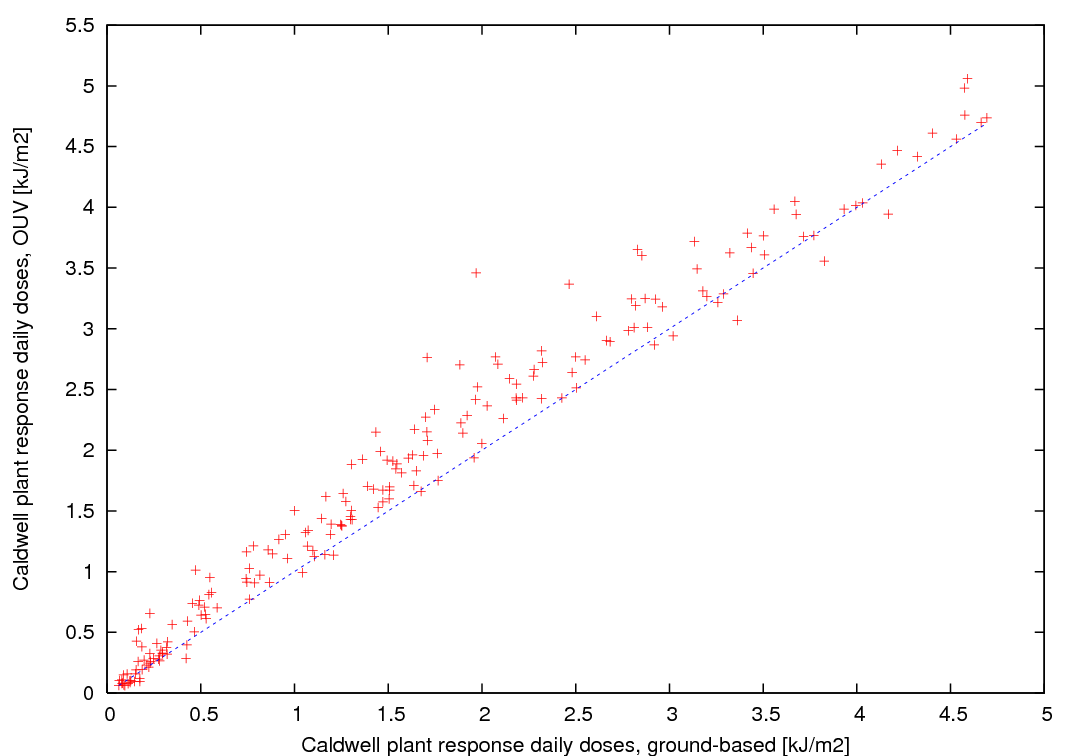 |
|
| SCUP-h | 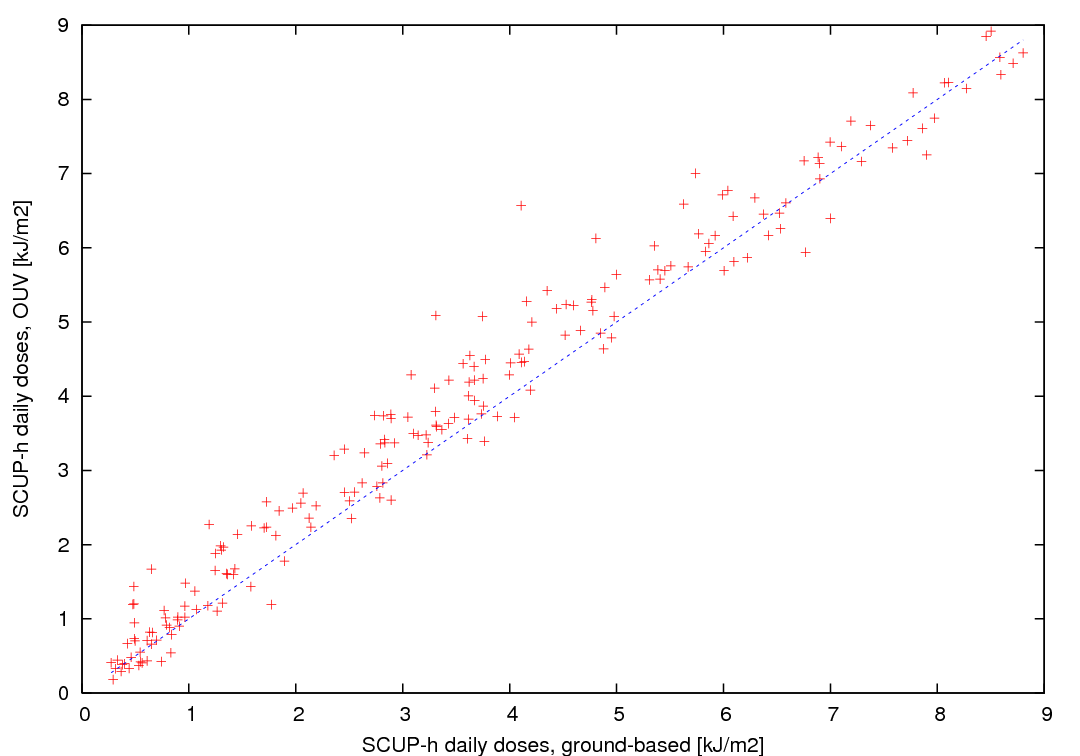 |
|
| UV-A | 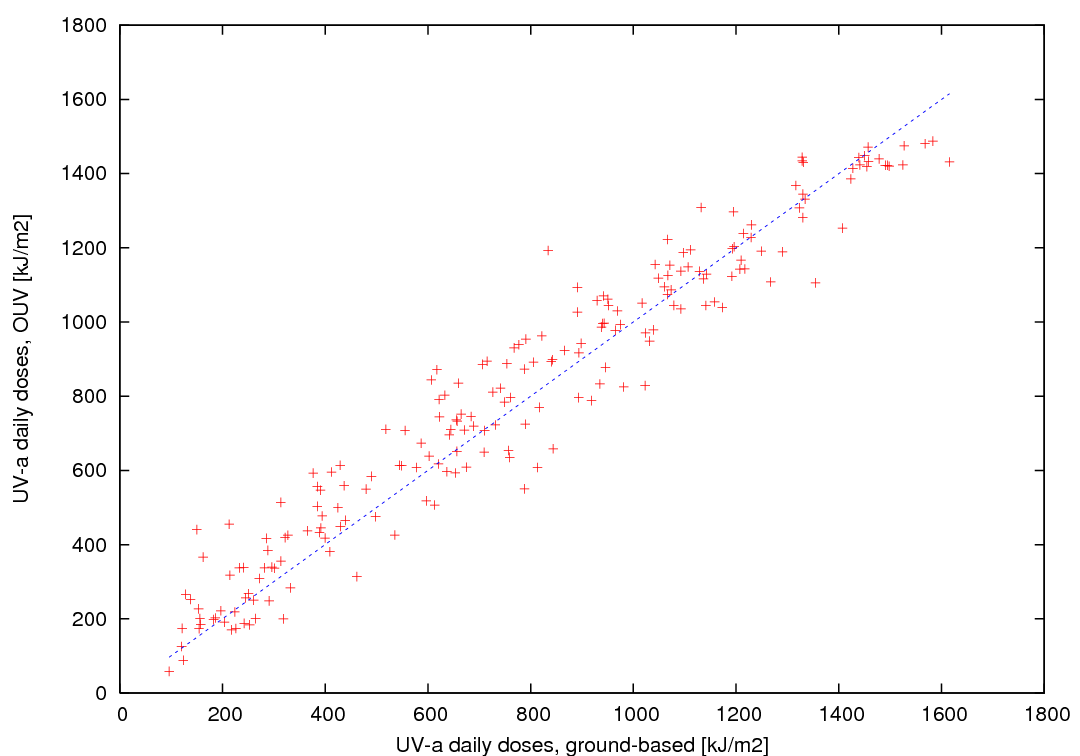 |
|
| UV-B | 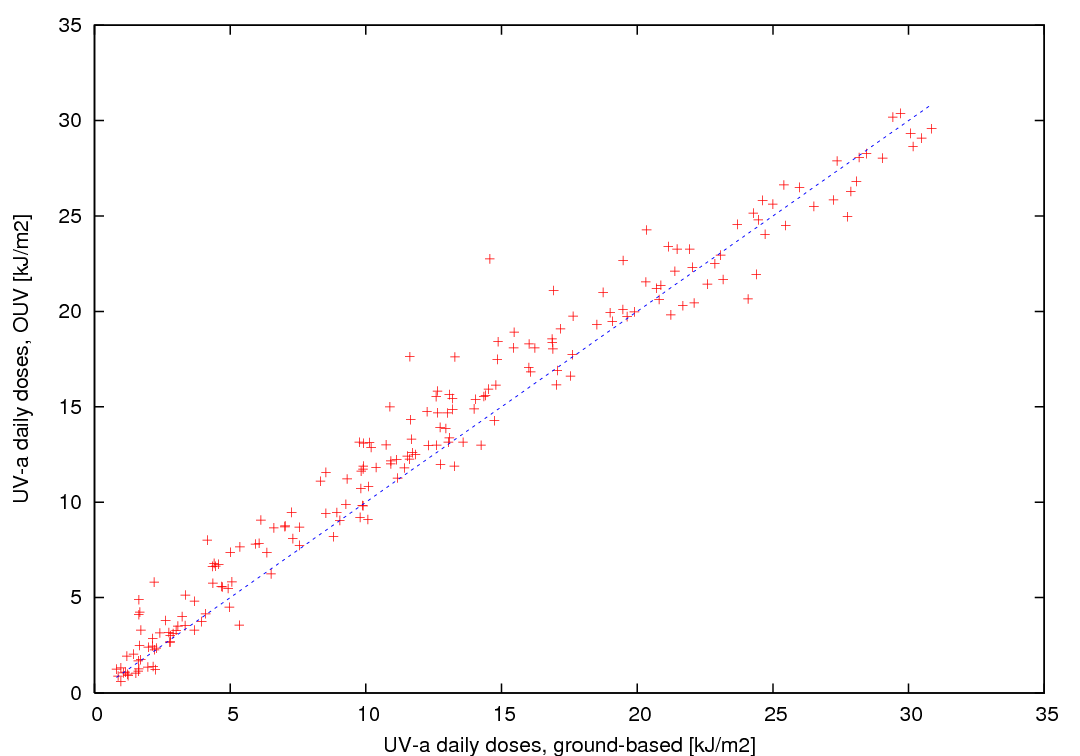 |
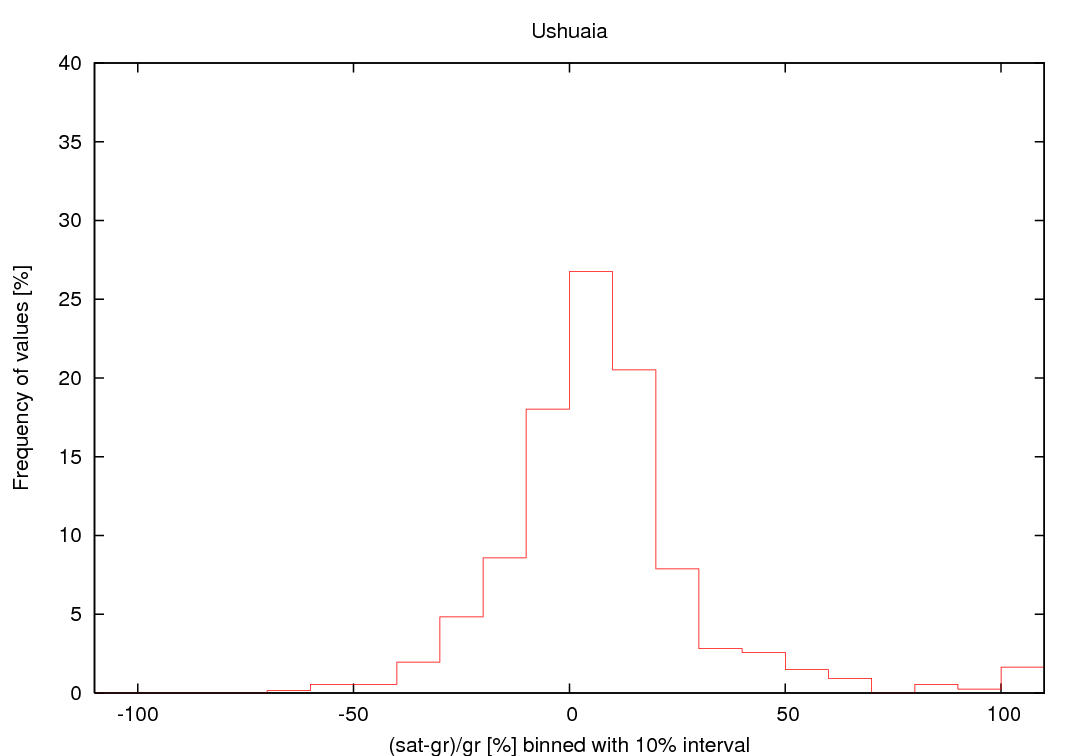
Histograms
| Weighting | Daily dose [kJ/m2] | Daily maximum dose rate [mW/m2] |
|---|---|---|
| CIE | 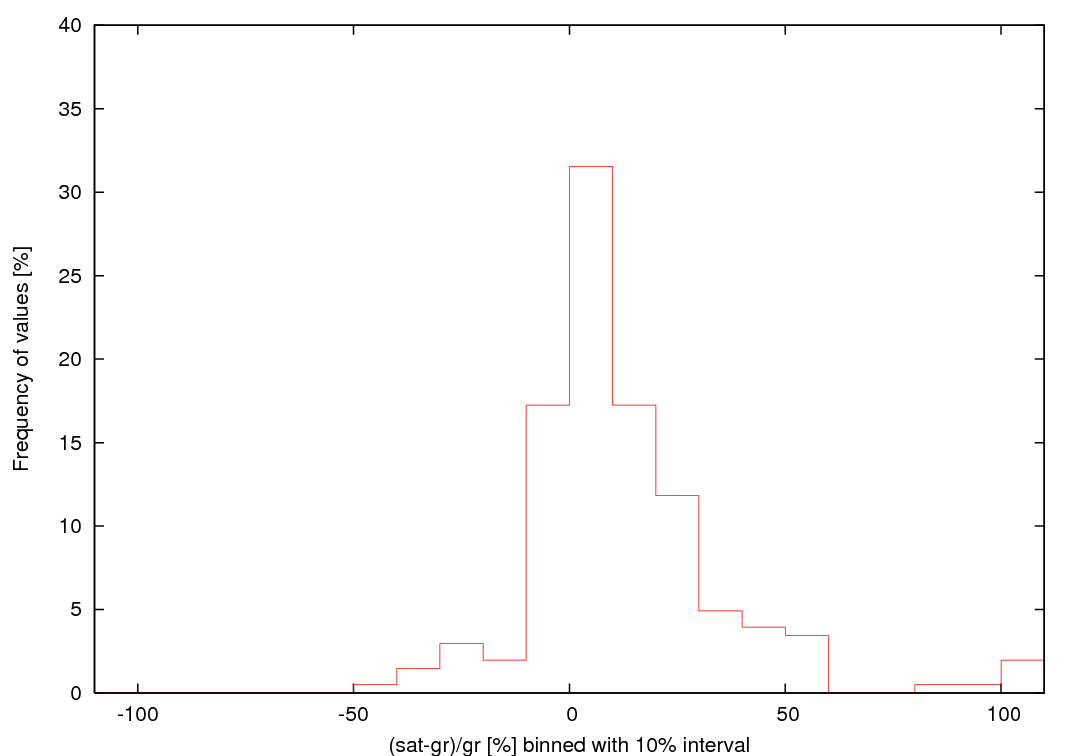 |
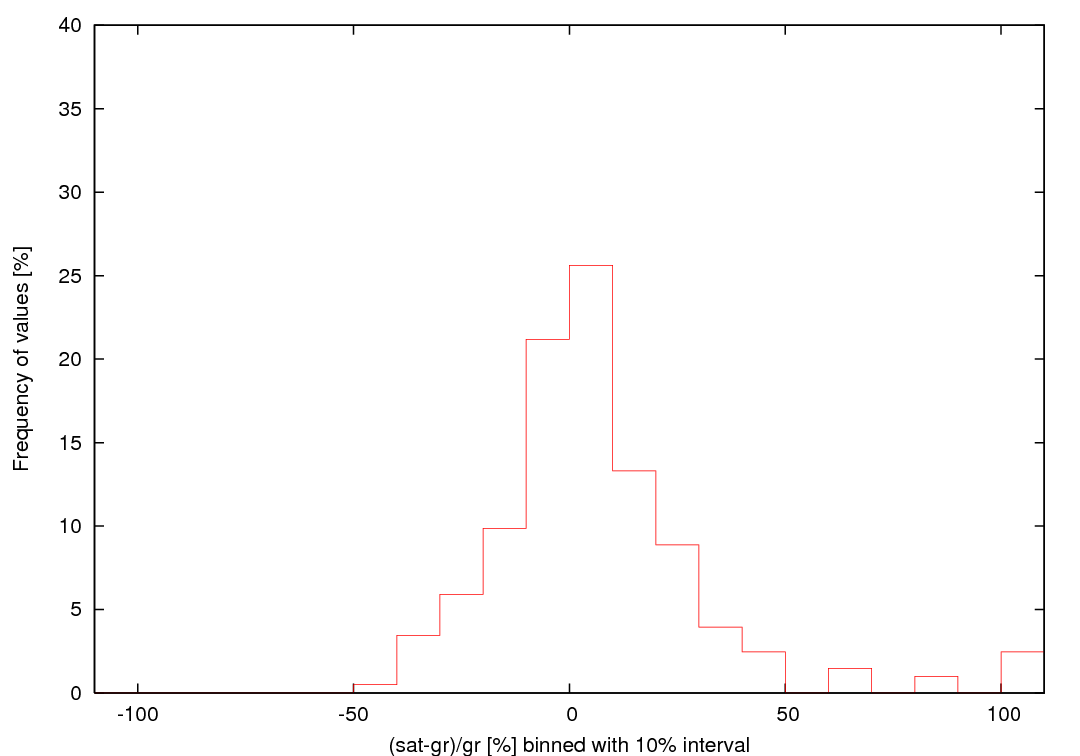 |
All stations
Scatter plots
| Weighting | Daily dose [kJ/m2] | Daily maximum dose rate [mW/m2] |
|---|---|---|
| CIE | 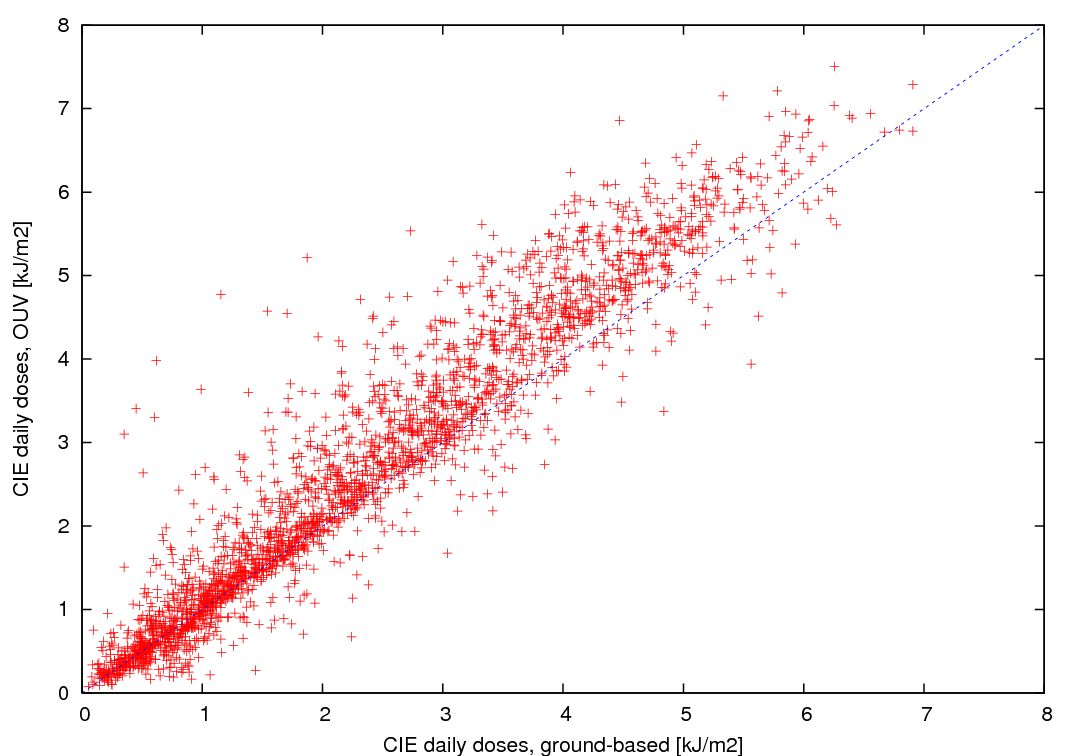 |
 |
Histograms
| Weighting | Daily dose [kJ/m2] | Daily maximum dose rate [mW/m2] |
|---|---|---|
| CIE | 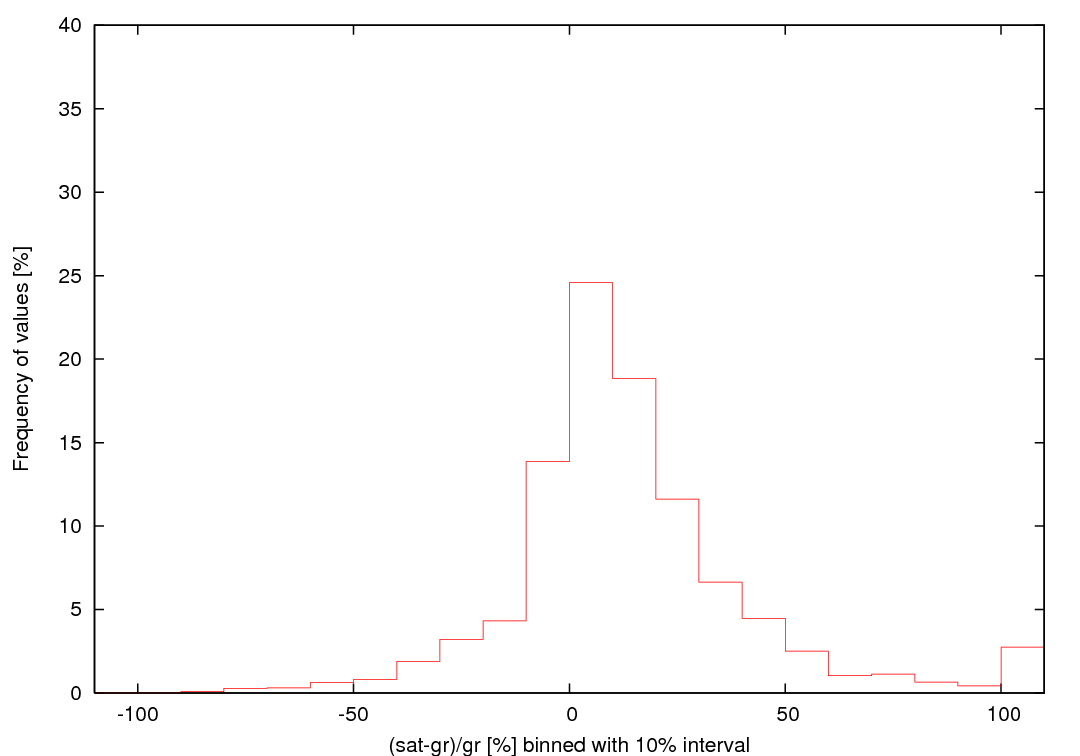 |
 |