OUV online quality monitoring
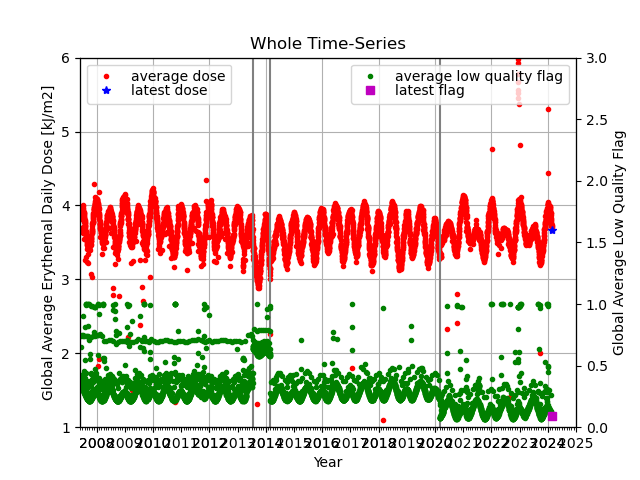
This page shows the global average values for erythemal daily dose as two time series. The idea is to constantly monitor the measured values and observe sudden changes which would indicate possible failure in the satellite measurement or data processing.
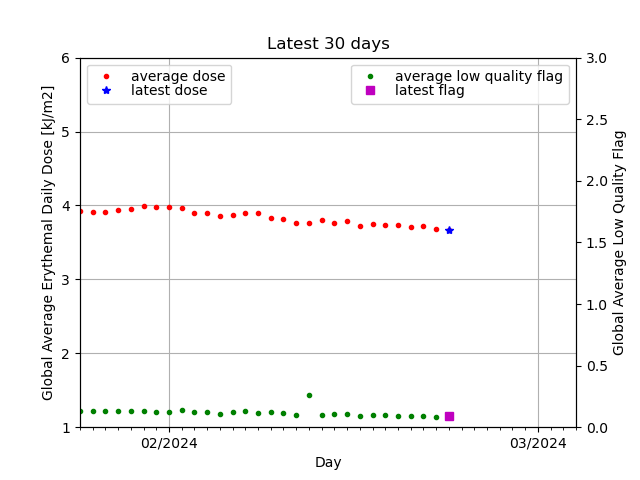
Red markers represent the global average of the erythemal daily dose values. If the average global low quality flag value (green marker) is higher than 0.5, the red marker is not printed for that day. Averaged global daily dose and low quality flag values for the latest product are presented with blue and purple markers, respectively.
NOTE: Every four weeks GOME-2 instrument onboard Metop-B satellite performs calibration routines (more info on GOME-2 calendar and GOME-2 timeline), leading to larger amount of missing pixels and low quality flags. This is part of the normal operation of the instrument and doesn't indicate low OUV product quality.
IMPORTANT! GOME-2 onboard Metop-A was switched to reduced swath width (960 km) 15 July 2013. This event decreased the global average values for erythemal daily dose (red markers) as can be seen from the long-term monitoring graph. The more wide-spread global average values of erythemal daily dose during that time are due to the dominance of lower EDD values in high latitudes when the satellite coverage near the equator is poor due to narrower swath width.
On 1 March 2014, OUV data processing was switched to use Metop-B GOME-2 data, which has nominal swath width of 1920 km.
Online monitoring of erythemal daily dose (30 days):
Online monitoring of erythemal daily dose (long-term):